
Power BI is one of the most widely used tools for data visualisation and analysis. Many organisations, however, face the question of how to connect it effectively to corporate data warehouses so that reporting is not limited to one-off analyses but is based on centrally managed, consistent and reliable data. RCZ covers the entire data workflow – from collection and transformation to creating outputs. The key element is the data warehouse (DWH), which ensures data management, historisation and consistency. For Power BI users, RCZ also offers a dedicated Power BI connector that enables easy and secure connection to the RCZ data warehouse without complex configuration.
This approach lets organisations take advantage of the full flexibility of Power BI while building on stable, verified data. If you already use Power BI and are looking for a reliable way to connect it to your reporting, our connector is the optimal path.
Below, we explain how Power BI connects to RCZ, the key aspects of data model design and the benefits of this solution for high-quality, sustainable reporting.
The foundation of effective reporting – whether in Power BI or RCZ – is a data warehouse (DWH). It ensures that data is centrally managed, historised and ready for systematic analytics. Without a good DWH, any reporting becomes complicated, error-prone and harder to maintain.
To make your work as easy as possible, we have developed our own Power BI connector that handles the connection without complex setup.
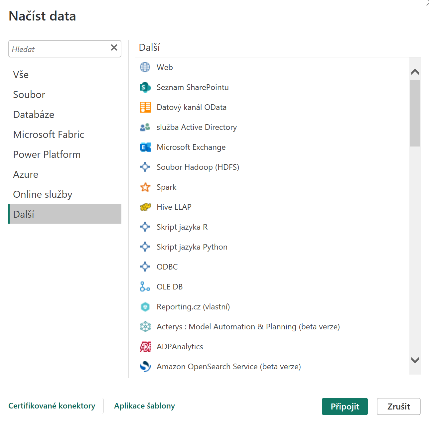
Correctly identifying tables and the relationships between them is essential for building a good data model in Power BI. The success of all reporting depends on careful model design – a poorly structured model can lead to incorrect or misleading analysis results.
We can help you with this process through a consultation, a practical demonstration or detailed documentation. To get to grips with the topic yourself, we recommend our documentation, which contains systematic procedures and concrete examples of implementation.
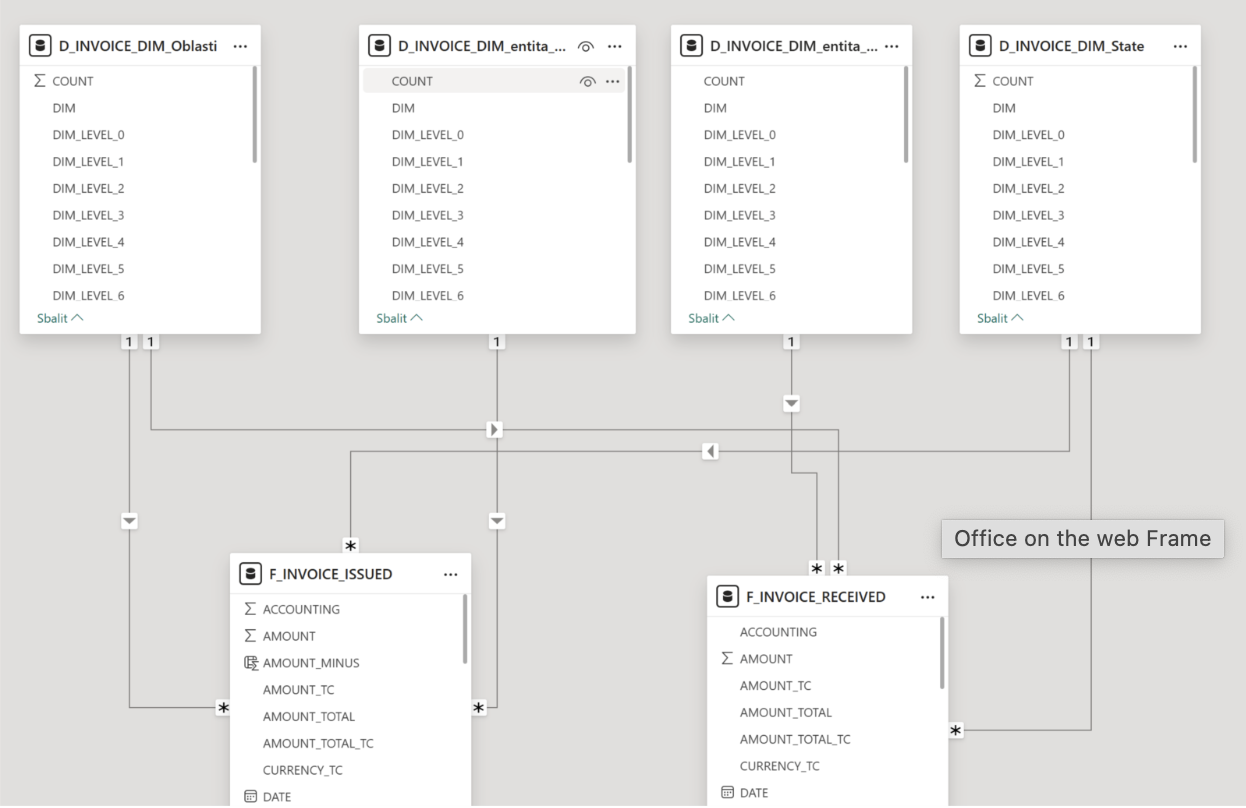
To build aging reports for invoices, receivables and payables, at least the following tables must be available (see the image below). These tables are the key building blocks of the model – without them, it is not possible to accurately calculate due dates, payment delays or the current status of payables and receivables.
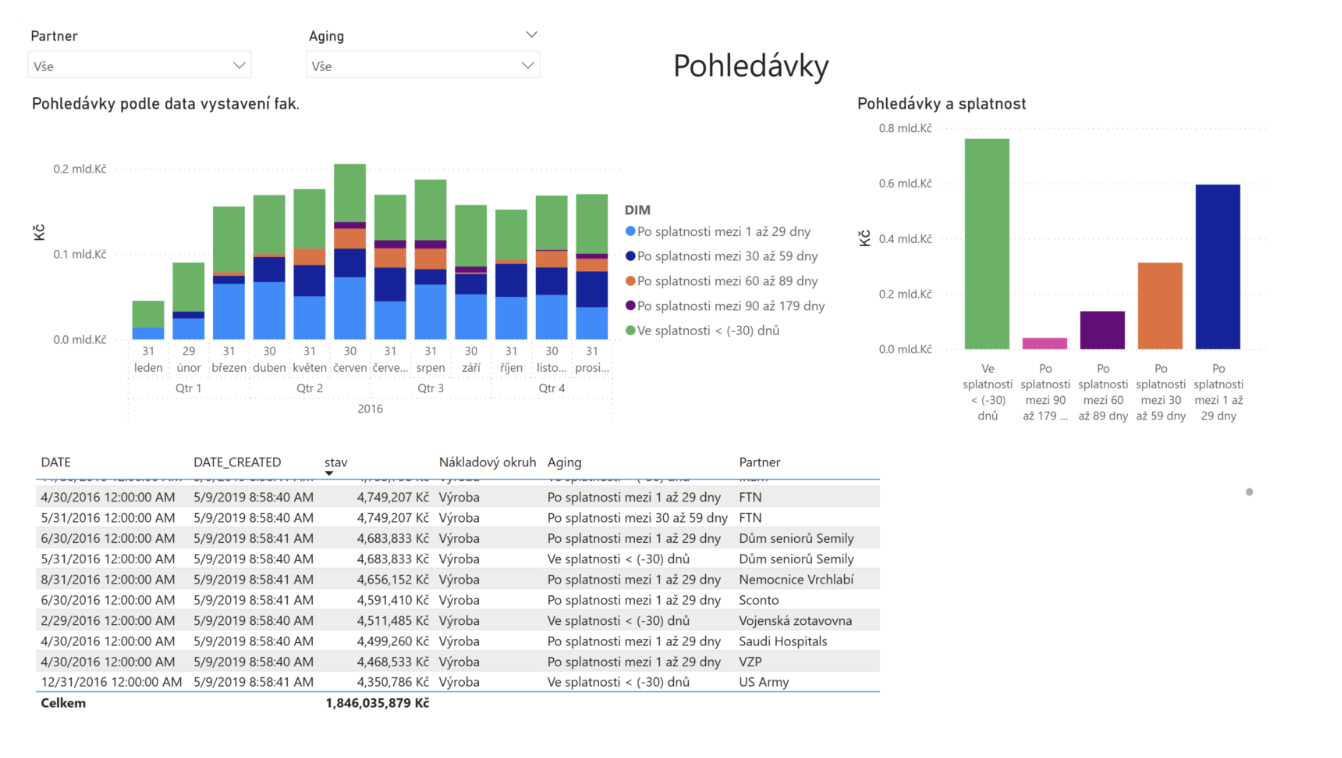
To illustrate, we have prepared a sample dashboard on RCZ data, created by external trainer Tomáš Hronek.
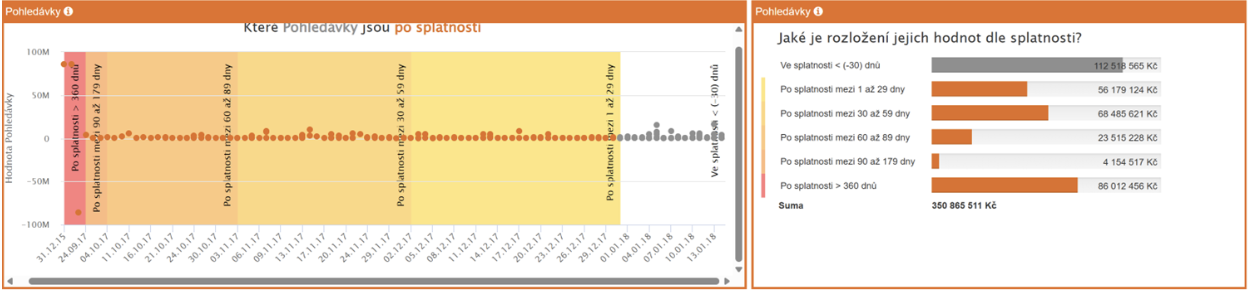
If you want to learn how to build your own dashboards in Power BI, now is the right time. Applications must be submitted by 5 October 2025, 11:59 pm at drivesoft.cz. The last run of the course “Power BI – Data Analytics Basics” will take place in November 2025.
The course is for anyone who wants to analyse and visualise data without programming or complex formulas. During the course, you will work with data from various sources – Excel, CSV, API and more.

Power BI trainer with more than 350 course graduates
He runs in-person and online courses for Laba, Engeto and Lovely Data. His clients include MSD, Komerční banka, Operátor ICT, Ness Czech and others.
Learn how reporting can change your business.
The security of company data is our priority. That's why we went through the rigorous ISO/IEC 27001 certification process, which confirms that our information security management system meets an internationally recognised standard.
For a few days, we swapped the office for Lipno and our computers for oars. This year, the whole Reporting.cz team headed to Frymburk for a few days together by the water.
The EU Pay Transparency Directive is taking concrete legislative shape in the Czech Republic. For CFOs, this means one fundamental change: the gender pay gap is no longer just a reputational issue – it is becoming a measurable regulatory risk with direct financial consequences.

Leave us your email. We will report to you first.
REPORTING.cz, s.r.o.
Budova Myslbek
Ovocný trh 1096/8
Praha 1, 110 00
IČ: 24248991
DIČ: CZ24248991
Společnost je zapsaná v obchodním rejstříku vedeném Městským soudem v Praze oddíl C, vložka 197204.
Ochrana osobních údajů (GDPR)
REPORTING.cz, s.r.o.
Budova Myslbek
Ovocný trh 1096/8
Praha 1, 110 00
IČ: 24248991
DIČ: CZ24248991
The company is incorporated in the Commercial Register administered by the Municipal Court in Prague, Section C, File 197204.
Data Protection (GDPR)


